
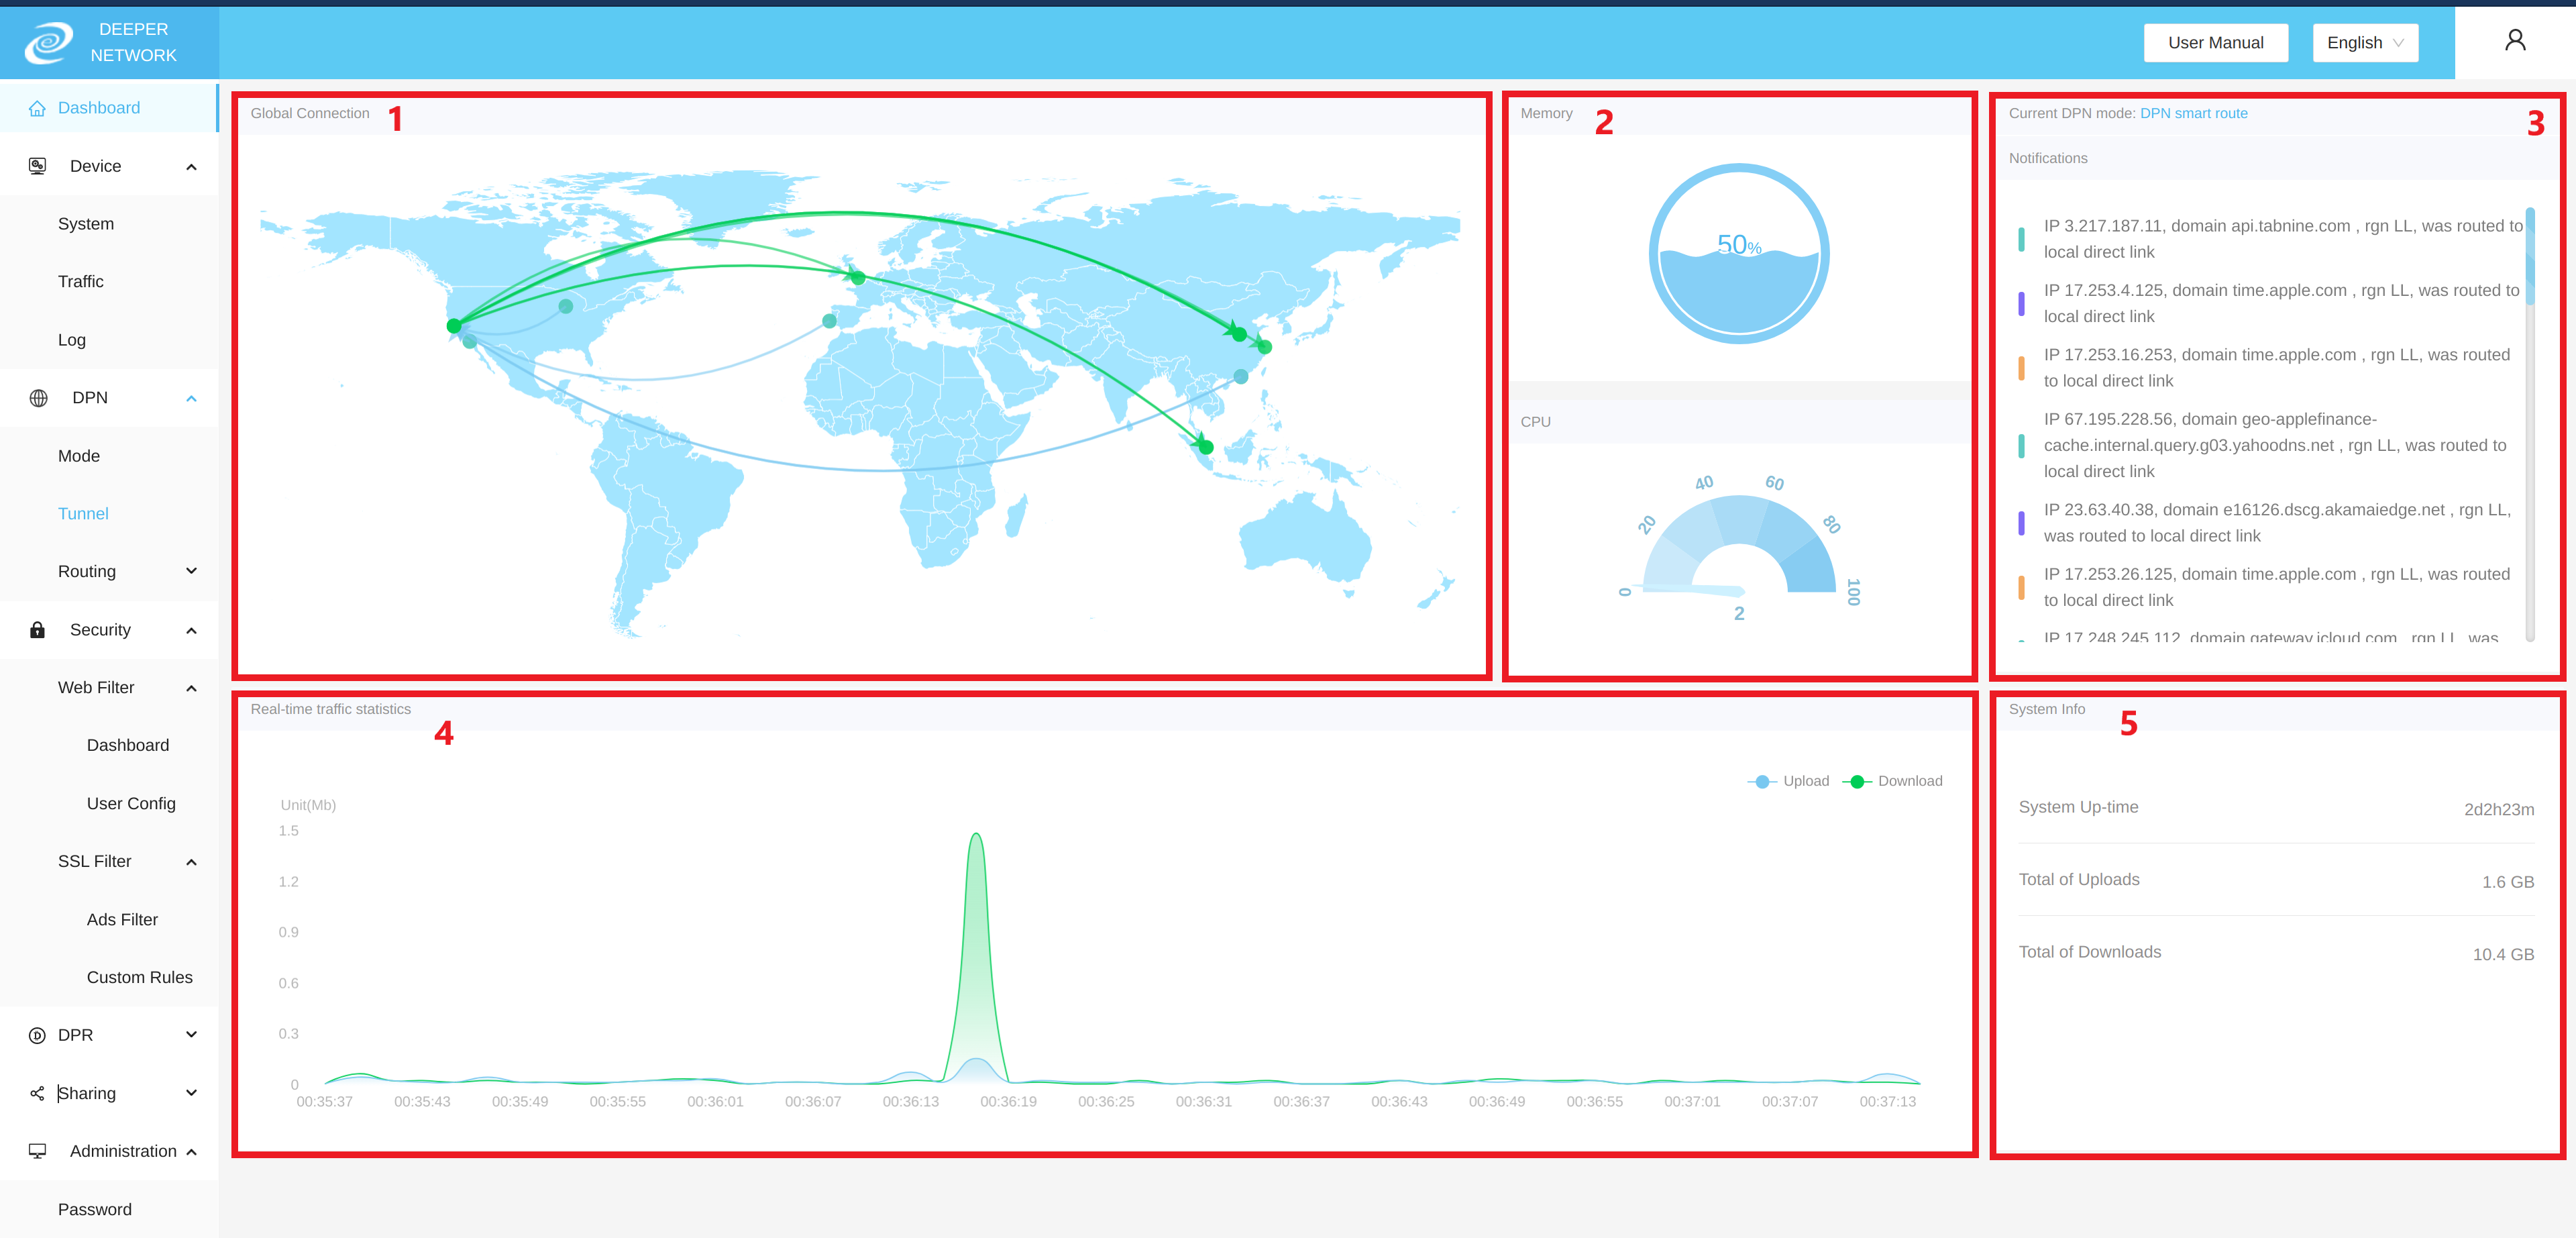
Section 1: Displays what tunnels are established and what nodes the device is connected to. Green lines show tunnels where traffic from the current device is routed to. Blue lines show tunnels of other devices that are using the bandwidth of the urrent device.
Section 2: Displays the current CPU and memory usage of the device in real-time.
Section 3: Displays the current DPN mode, node connection history and block history in real-time.
Section 4: Displays real-time network uploads and downloads. The green line shows download usage. The blue line shows upload usage.
Section 5: Displays the operating time of the device (time since last reset) and the total download and upload data usage during this time.
Comments
0 comments
Article is closed for comments.